Started 18th February 2016
Consisting of unnecessary tinkering with the project described in HC-SR04.
Common wisdom is that measuring echo time by amplitude is not accurate and better results can be obtained by modulating the frequency of the emitter - producing a 'chirp' [1][3][9] or modulating the phase.
It is within the capabilities of the ATMega 328p to measure each time the HC-SR04 analogue output signal crosses a threshold - every 25 μs (in one direction or every 12.5 μs in both). So it could detect changes in phase. The code is a rearrangement of that in HC-SR04, with a potentiometer to set the trigger level and the analogue output of the HC-SR04 going to the ATMega 328p analogue comparator input.
To change the phase it is necessary to drive the transmitting transducer oneself. I'd already removed it from the PCB in an attempt to reduce crosstalk. Simply connecting it to an ATMega 328p output pin works, although the signal level is reduced. The output transducer looks like a 2000 pF capacitor which at 40 kHz has a reactance of 2 kΩ. There are warnings on-line that in general driving ultrasonic transducers this way will shorten the life of the ATMega; I think this is unlikely to be true for the HC-SR04 transducers.
To give more power and ensure the transducer responded quickly I used the simple bridge amplifier in [4], but eventually I worked out how to get the ATMega to generate anti-phase outputs, which gives the same results with a lot less trouble - see later.
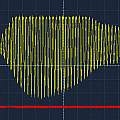
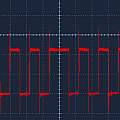
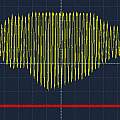
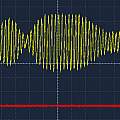
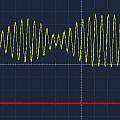
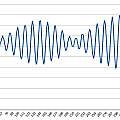
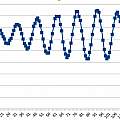
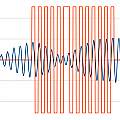
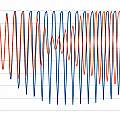
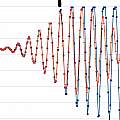
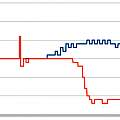
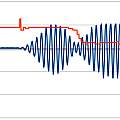
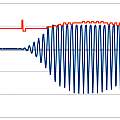
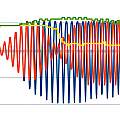
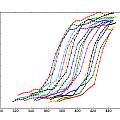
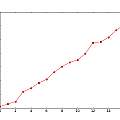
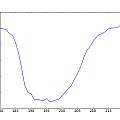
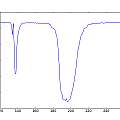
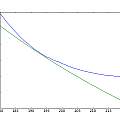
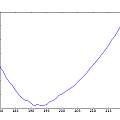
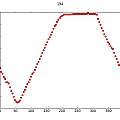
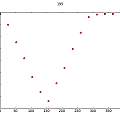
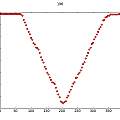
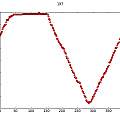
The first image shows the echo resulting from driving the transmitter transducer using the ATMega via the amplifier with a square wave, it's no different to using the HC-SR04's built in electronics. The second image shows the entire drive signal with added phase modulation. The third shows the resulting echo - there is a small effect. I had simply generated a drive signal with a period of 25 μs. Changing the period to 24.25 μs gives the much bigger result in the final image. The original HC-SR04 electronics use a 25 μs period - by changing this the range could be extended.
Presumably only when being driven at its resonant frequency is the transducer in phase with the driving signal. The phase modulation consists of stretching one high phase to double the normal length - a 180° shift. I found the period that gave the maximum effect by experiment.
The code in the following link uses 'bit banging' to generate the transmitted pulse with phase modulation and the analogue comparator and capture register to record the time the received signal crosses a voltage level supplied from a potentiometer. Since the code works on transitions in both directions, this level is adjusted to be the mid point of the received signal amplitude to give equal times between events.
Opening the serial monitor allows typing the command:
get
This prints the time and phase for each zero crossing. Results are similar to those obtained below using the ADC.
Download
Finally the obvious approach
Why not just feed the analogue output of the HC-SR04 into the ATMega 328p analogue to digital converter input. The ADC is usually considered to be slow. An extensive Google came up with the result that most people think using the ADC at high speed will damage the processor, only a few projects have used higher speeds, typically Arduino based oscilloscopes.
It takes 13 ADC clock ticks to do one conversion, the ADC clock is a divided down version of the processor clock. Various prescaling values are available. The table in [5] shows that when running from a 16 MHz processor clock divided by 4 the sampling rate is 307 KHz.
Typically code enables the ADC interrupt and stores the conversion result from inside the interrupt routine. I found that using C and the standard interrupt handling I could not make this go faster than 250 KHz - the speed of the code limits the ADC rate. The 13 ADC ticks translate to 52 processor cycles (with a divide by four prescale) to handle the interrupt. [17] notes that the standard interrupt code uses 23 cycles on entry and 19 on exit, total 42.
Processing the ADC results without interrupts allows a sampling rate of 307 KHz and this does produce usable data. It is also possible to repeat the measurement with a half sample time delay and double the number of samples, giving a rate of 614 KHz.
Given a transmit pulse period of 390 processor ticks, sampling at 13 x 4 processor ticks gives 7.5 samples per transmit cycle. Repeating the measurement with a shift doubles this to 15 samples per transmit pulse cycle.
At 16 MHz a processor tick is 0.0625 μs - 390 of them are 24.375 μs - a frequency of about 41 kHz.
Images show an echo pulse on oscilloscope and then results of sampling on ATMega at 614 KHz.
To get the best accuracy one wants to reliably locate the same position in the echo each time. For example the peak of the second oscillation (or whatever). The problem is that such localised features vary - the second and the third oscillations will have similar amplitudes and it will turn out to be difficult to pick one out from the other. It would be better to use data from the whole echo to work out a position and take advantage of errors being averaged out.
A common technique is to cross-correlate the transmitted and received signals [10]. Summing the product of the two signals and varying the position of the transmitted signal to maximise the result. This amounts to measuring the phase change - if the phase of the transmitted and received signals are not the same there will be large negative contributions.
This graph shows the result of cross correlation of the received echo with the transmitted signal positioned to maximise the result. The position is as expected with the two out of phase parts of the transmitted signal over the two out of phase parts of the received signal. This is not the real position of the transmitted signal with respect to the received signal - but that does not matter as long as it produces a useful result. It turns out that mostly it gives accurate distances, but occasionally gives a result out by one wavelength - so not useful.
An interesting thing to look at is a comparison of the received pulse with and without a transmitted phase change. Since the receiver can't know if there is going to be a phase change until it happens the two will be the same until the phase change occurs. The time at which they differ is the latest the phase change in the transmitted signal can have arrived. For this test I used a direct signal from transmitter to receiver and not an echo.
The graphics show the transmitted phase change result in red and the result with no transmitted phase change in blue. In the second graph the black marker shows the first point at which they start to differ - it is roughly the sixth peak. Relative to the blue curve it can be seen how the phase of the red curve changes. It is noticeable the phase change is only significant long after the amplitudes of the two curves have diverged.
The position found from this test is in agreement with looking for the first sign of any change in the received signal and then counting peaks. The transmitted signal only has 11 peaks, it follows most of what appears in the received data is a result of the transducer oscillating after the transmitted signal has finished.
These graphs show the phase for the above signals. First received phase with and without phase change in transmitted signal - phase in the range 0..30. Second received signal and phase for transmitted phase change. Third received signal and phase for no transmitted phase change. Last phase and signal with and without transmitted phase change.
The conclusion from those is that the received signal takes some time to get into phase with the transmitted signal, and as a result a 180° shift in the transmitted signal does not give a 180° shift in the received signal. The phase starts to diverge about the same time as the amplitudes.
The code used to produce the data in these graphs is available from the following link. This uses 'bit banging' to generate the transmitted pulse and processes the ADC results without interrupts. It doubles the sampling rate by repeating the measurement with a half wavelength delay and generates results for both a transmitted pulses with and without a phase change. Opening the serial monitor allows typing the commands:
getget2
The first prints the results from a transmitted phase change pulse and the second adds to each line the no phase change pulse result.
Download
Both the above programs create the transmitted signal by 'bit banging', changing an output pin by sending it values, this needs precise timing of code and is tedious to write. The next idea is to use the ATMega 328p's built in PWM to generate an arbitrary pulse train from a table of values. Instead of a single output which has to be fed to a bridge amplifier, the processor can generate both in-phase and anti-phase outputs allowing the transmitter to be directly connected between two output pins.
The code produces a non-repeating waveform but it is trivial to change it to run continuously. There will be a minimum duration for pulses since the code has to load the length of each pulse into the PWM timer whilst the pulses are being output. Fast PWM mode is used, with the input capture register used to set the top value on Timer 1. Double buffering on the two output compare registers means that their values have to be loaded one cycle ahead.
Other than how the transmitter is driven, the programs are similar to the previous two, supporting the same serial monitor commands.
Download
- pingzero11 Arduino sketch (8th April 2016) comparator/capture with PWM generation
- ping328ADC8a Arduino sketch (15th October 2018) use ADC with PWM generation
Above the absolute phase of the echo signal is plotted against time. It is easier to understand if the change in phase with time is plotted. To do this code looks at the phase of the echo once the amplitude gets above some level, and then calculates changes in phase from this value as time goes on.
The first graphic shows the result of of doing this for the usual set of 17 distances between the receiver and transmitter transducers and the target at 1 mm intervals. The change in phase is similar for each distance but the curve is moved along in time due to the different distance.
It is possible to extract the change in the position of the phase change curve with varying distance, this is shown in the second graphic. I simply calculated the time the phase change equalled 4 (because this value gives the best result). Phase here runs from 0..15.
By reversing the process one could calculate the transducer distance.
Frequency Response
With the ATMega generating the transmitter drive signal it is easy to scan frequencies and plot the response of the transducers plus electronics. The first two graphs show amplitude against half period measured in 16 MHz processor clock cycles. For example 195 on the graph is a frequency of 16000000/(2*195) or 41 kHz. The graphs show the minimum amplitude (because the maximum clips), so maximum response is around 195 and as mentioned above this is slightly different to 40 kHz (which is 200 on the graph). The second graph shows another interesting peak around 57 kHz.
The next two graphs show how phase changes with period. In the first one the green curve is a calculated ideal phase (inversely proportional to wavelength and period). The blue curve is the measured phase. The second graph shows the difference. Phase is in the range 0..1.
To generate this data the transmitter and receiver from the HC-SR04 were positioned 400 mm apart and the ATMega generated a long series of pulses, after things had stabilised the ADC was used to record the received signal.
Because the transmit frequency is known and each cycle is the same, it is possible to combine the ADC data to display a received cycle with higher accuracy. The four graphs show this for half periods 194..197 clock cycles. Note 2*195 is 390 which is 7.5 ADC sample times; at this period every two cycles are in sync with the ADC; as a result most of the data points coincide. Since these graphics should be sine waves there is a lot of clipping going on.
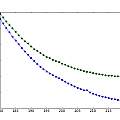
What happens if the distance between the transducers is changed. This graph shows the phase change with period for two distances; green 400 mm and blue 300 mm.
In the sketch below issuing the serial monitor command 'get' will set off scanning and produce 1024 ADC samples for each half period in processor cycles between the two values in the code 'STARTVALUE' and 'ENDVALUE'. Each set of data is preceded by the number -1 and then the half period.
To generate the graphs there is a Python program which analyses the output from the Arduino sketch.
Download
- response01 Arduino sketch (12th May 2016) scan frequency and output response.
- response03.py and data (12th May 2016) Python code to produce graphs of frequency and phase response
Different transducers
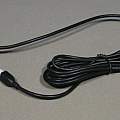
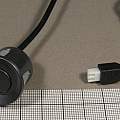
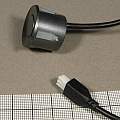
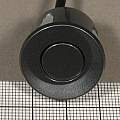
I bought "4PCS MULTIFUNCTION REVERSING AID RADAR SENSOR PROBES CAR PARKING SENSORS GREY", these are electronically similar to the HC-SR04 transducers but less sensitive (the transmitted signal is not as strong and the received signal is weaker) - probably as a result of being weatherproof. The grid in the photo is 1 mm.
- Ultrasonic Anemometer (Wind speed and direction)]
- Time of flight difference in hardware
- Spread Spectrum Phased Array Sonar
- A Sensitive DIY Ultrasonic Range Sensor
- Fast sampling from analog input
- Girino - Fast Arduino Oscilloscope
- ATmega ADC in-depth analysis
- ATmega ADC
- Pulse compression - Wikipedia
- Cross correlation - Wikipedia
- Matched filter - Wikipedia
- FAST ADC USES OLD SCHOOL SCOPE HACK FOR 48 MSPS
- http://blog.benoitblanchon.fr/arduino-code-size-and-assembly/
- Secrets of Arduino PWM
- 3Pi robot - pulse with modulation (PWM)
- POP FREE MICROPHONE ON/OFF SWITCH CIRCUIT David Johnson
- Interrupts Nick Gammon
- ARDUINO ULTRASONIC ANEMOMETER
